Automatic digitization
After the clicking of "Crop" button a processed figure with detected axes labels, points and errorbars will appear in a "Plot" tab. The x and y labels will be marked with the red and green boxes respectively and the detected label values will be displayed. The respective gridlines will be added on the top of the image.
Detected points and errorbars will be shown in different colors, reflecting their group belonging. Upon pointing mouse cursor on a specific point,values of the point itself and a corresponding errorbar will be displayed as a tooltip. All point values will be available in a "Table" tab. If no y errorbars are detected the min and max errorbar values will be set to the y point coordinate.
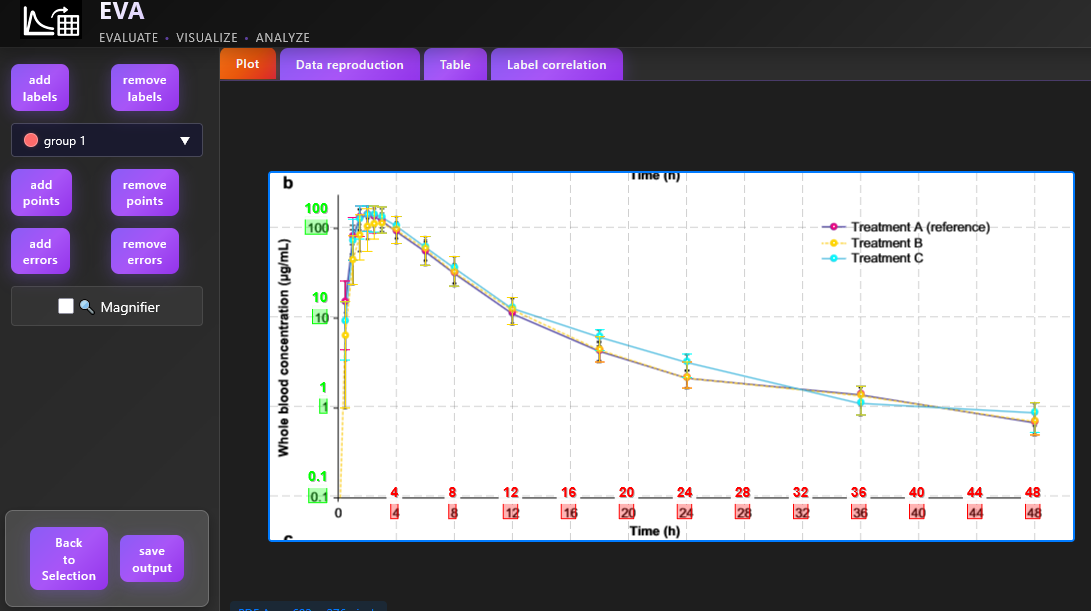
In case of raster image no detected elements will be displayed.
Label detection check and correction
In case of linear scale a linear correlation between label positions and label values is assumed, the user can check this correlation for both x and y axes in "Label correlation" tab to identify outliers. In case of log scale a linear correlation between decimal logarithm of label positions and label values is assumed:
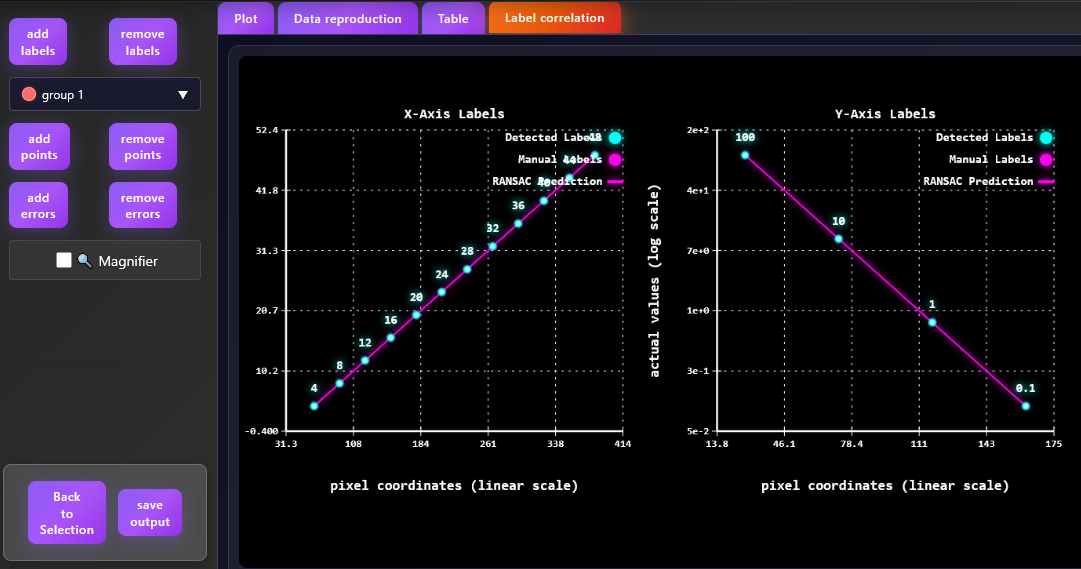
In case if the image text element is misclassified as a label it can be removed on the plot tab after the clicking on the "remove labels" button and clicking on the respective label with a mouse. The label correlation plot will be updated respectively.
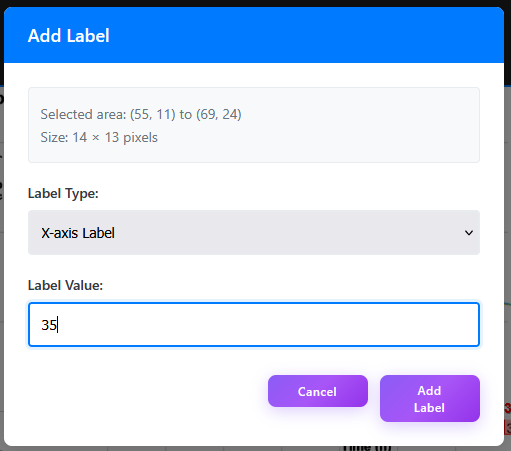
The user can also manually add labels by clicking on the "add labels" button and selecting the label region. After it a new window will pop up where the user can specify the label type (x or y) and a label value.
Point and errorbar correction
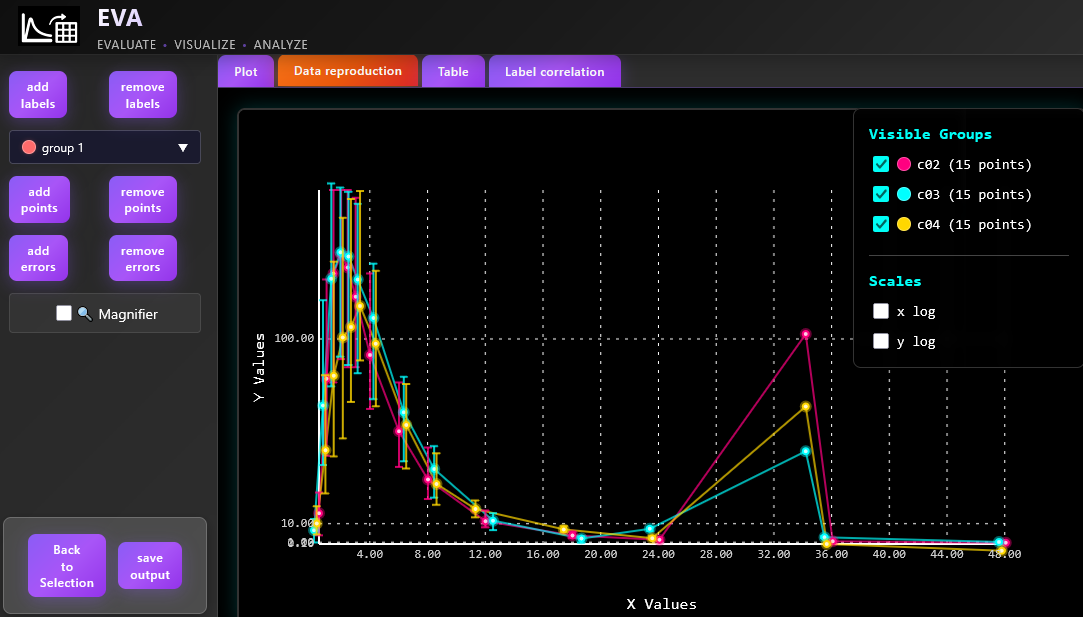
Digitized data are displayed in a "Data reproduction" tab:
The user can also remove the points or errorbars on the "Plot" tab. To remove the point or errorbar the user can press "remove points" button and click on the point, no group selection is required. In contrast to the point removal, errorbar removal requires group selection as errorbars are oftenly overlapped.
To add a point or errobar the user should first select point group from the dropdown menu on the left side bar. Th dropdown menu contains names of the detected groups as well as default group names (group 1, group 2 etc.), which are used in case when the whole point group was not detected by the algorithm. The user then should switch to the add point/ add errorbar mode and click on the point/ upper or lower errobar cap to digitize it.
To facilitate manual point and errorbar processing the user can activate magnifier by selecting "Magnifier" checkbox. The "Table" tab will be updated after each label or point/errorbar addition or removal to display actual dataset.