Data Quality Check
Before beginning any modeling or analysis, it is essential to ensure the integrity and consistency of the dataset. The Quality Check section of the Data Management module provides automated tools to detect common issues such as missing values, inconsistent dosing records, and irregular time patterns. Addressing these potential problems early in the workflow is critical for ensuring reliable model performance and avoiding biased or misleading results.
Once your dataset has been properly initialized in the Data section and covariate columns have been appropriately defined, the Quality Check section becomes active and available for use.
The data checks are organized into three dedicated tabs, each focusing on a specific type of data:
1. Covariates
Once the dataset has been initialized and continuous, categorical, and (if present) time-varying covariate columns have been declared in the Data section, the Covariates tab becomes active. It summarises seven automated checks, each accompanied by contextual messages and—when appropriate—tables that highlight the issues detected.
-
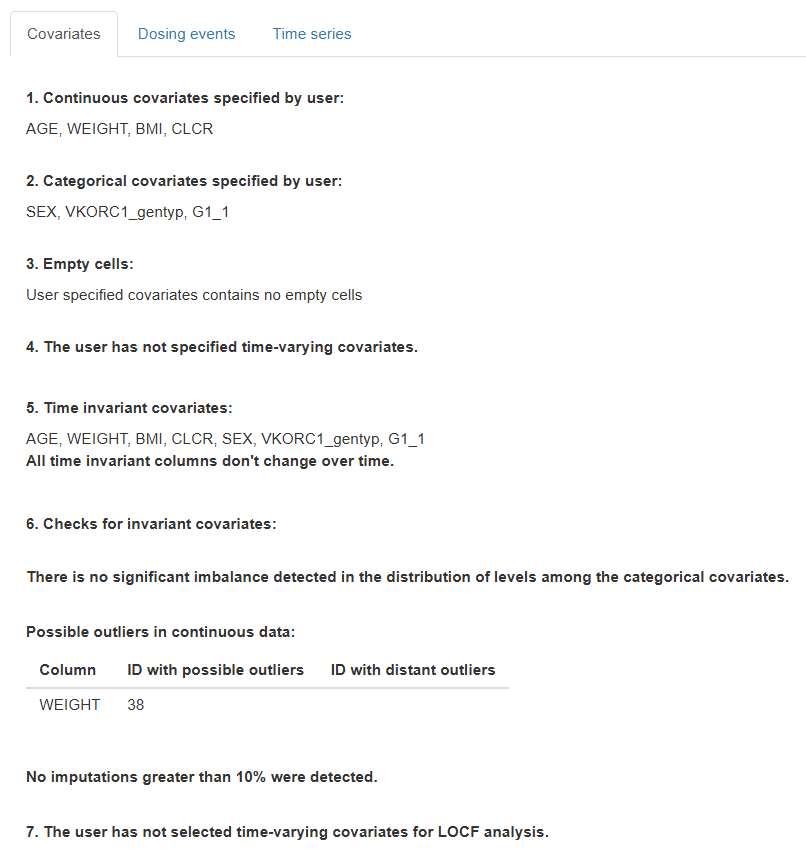
Declared continuous covariates
- Lists the continuous covariates provided by the user.
- If none were specified, the message “The user has not specified continuous covariates.” is shown.
-
Declared categorical covariates
- Analogous to point 1 but for categorical covariates.
- If none were specified, a corresponding message is displayed.
-
Missing-value scan
Searches the declared covariate columns for empty cells.
- If empties are found, the message "Empty cells were found in these columns and IDs:" appears, followed by a table listing the affected columns and IDs.
- Otherwise, "User-specified covariates contain no empty cells."
-
Time-varying columns change check
Verifies that each user-defined time-varying covariate truly varies within an ID.
-
Outcomes:
- "All user-defined time-varying columns change over time."
- "User-defined time-varying columns that don’t change over time:" (followed by offending column names).
- If no time-varying covariates were declared: "The user has not specified time-varying covariates."
-
-
Time-invariant stability check
Display a list of considered time invariant covariates and ensures that covariates expected to be constant within an ID do not drift over time.
- Outcomes:
- "All time invariant columns don't change over time."
- "Time invariant columns that change over time: " (followed by offending column names).
- Outcomes:
-
Invariant-covariate diagnostics Three complementary tests are run:
6.1 Balance of categorical covariates
Flags any categorical covariate where a level represents < 15 % of IDs.
- Shows "Uneven distribution of covariate levels in columns:" plus a table of covariate/level pairs.
- If no imbalance: "There is no significant imbalance detected in the distribution of levels among the categorical covariates."
6.2 Outlier detection in continuous covariates
Usual outliers: values outside \([Q1 - 1.5 × IQR\) ; \(Q3 + 1.5 × IQR]\) 1. Distant outliers: values outside \([Q1 - 2.5 × IQR\) ; \(Q3 + 2.5 × IQR]\) and beyond the 5th/95th percentiles.
- If found, the message "Possible outliers in continuous data:" appears with a three-column table: covariate, IDs with usual outliers, and IDs with distant outliers.
- Otherwise: "No possible outliers were detected."
6.3 Potential imputations in baseline covariates
For continuous covariates not marked as time-varying, the routine looks for values repeated in > 10 % of IDs—a sign of bulk imputation.
- If detected, the message "Potential imputation for baseline covariate > 10 %:" appears with a table of covariates and affected IDs.
- If none: "No imputations greater than 10 % were detected."
-
LOCF detection in time-varying covariates
Aims to identify possible Last Observation Carried Forward (LOCF) practices, where a value is repeated across successive time points.
- If any time-varying covariate shows > 3 consecutive identical values within an ID, those IDs and covariates are reported.
- Otherwise: "No LOCF were detected."
2. Dosing events
The Dosing events tab evaluates the internal consistency of all dose-related columns. For full functionality, the dataset should contain the following fields:
AMT– dose amountEVID– event identifier (0 = observation, > 0 = dose or other event)MDV– missing-DV flag (0 = DV present, 1 = DV missing)CMT– compartment number receiving the dose orADM– administration type (Simurg accepts either)DUR– infusion duration
If one or more of these columns are absent, any check that relies on that column is skipped and the message "The column required for this check is missing." is shown.
-
Presence of required columns
Confirms that all five dose-related columns are in the dataset.
- If any are missing: "The following required columns for Dosing-event checks are missing in the dataset:" followed by the list.
- If none are missing: "All expected Dosing-event columns "AMT", "EVID", "MDV", "CMT", "ADM", "DUR" are present in the dataset."
-
AMT vs EVID consistency
Detects rows that combine an observation flag with a non-zero dose amount (
EVID = 0 & AMT ≠ 0), i.e., dose information placed in observation rows.- Inconsistencies: "Inconsistencies have been found between the AMT and EVID columns. Rule: EVID = 0 & AMT ≠ 0" plus a table of
ID,TIME,AMT,EVID. - None: "No inconsistencies have been found between the AMT and EVID columns."
- Inconsistencies: "Inconsistencies have been found between the AMT and EVID columns. Rule: EVID = 0 & AMT ≠ 0" plus a table of
-
Zero-dose events
Flags dosing rows that declare a dose amount of zero (
AMT = 0 & EVID ≠ 0).- Issues found: "Dose amount 0 in dose event. Rule: AMT = 0 & EVID ≠ 0" plus a table of
ID,TIME,AMT,EVID. - None: "No zero-dose amount for dose event."
- Issues found: "Dose amount 0 in dose event. Rule: AMT = 0 & EVID ≠ 0" plus a table of
-
EVID vs MDV coherence
Looks for dose events that also claim a non-missing dependent value in the same row (
EVID ≠ 0 & MDV = 0).- If present: "Possible inconsistencies have been found between the EVID and MDV columns. Rule: EVID ≠ 0 & MDV = 0" plus a table of
ID,TIME,MDV,EVID. - None: "No inconsistencies have been found between the EVID and MDV columns."
- If present: "Possible inconsistencies have been found between the EVID and MDV columns. Rule: EVID ≠ 0 & MDV = 0" plus a table of
-
AMT supplied without CMT/ADM
Checks for non-zero doses that lack a target compartment or administration type (
AMT ≠ 0 & (CMT = 0 | ADM = 0)).- Inconsistencies: "Dose amount without compartment (CMT) or administration type (ADM)" plus a table of
ID,TIME,AMT,CMT/ADM. - None: "No inconsistencies have been found between columns AMT and CMT or AMT and ADM."
- Inconsistencies: "Dose amount without compartment (CMT) or administration type (ADM)" plus a table of
-
Infusion-duration logic
Verifies that dose rows belonging to a given CMT/ADM are either all bolus (
DUR = 0) or all infusions (DUR > 0). Mixed usage triggers the warningAMT ≠ 0 & (all DUR = 0 | all DUR ≠ 0)- If violated: "Infusion duration time zero were detected" plus table of
ID,TIME,AMT,CMT/ADM,DUR. - None: "No issues found with infusion duration time."
- If violated: "Infusion duration time zero were detected" plus table of
-
Duplicate dose records
Identifies duplicate dosing rows—same
ID, sameTIME, sameCMT/ADM, and non-zeroAMT*.- Duplicates: "Duplicates: same time, same CMT or ADM, and AMT ≠ 0 were detected." plus table of
ID,TIME,AMT,CMT/ADM - None: "No duplicate time for same dose amount."
- Duplicates: "Duplicates: same time, same CMT or ADM, and AMT ≠ 0 were detected." plus table of
The information returned by these checks helps correct dosing-record errors before advancing to modelling or simulation steps.
3. Time series
The Time Series tab contains 8 specific checks that assess the quality and consistency of longitudinal observations across time. These checks help ensure that observational data are well-structured, logically consistent, and reliable for analysis.
To enable all the checks in this tab, the dataset must include the following columns:
ID– subject identifierTIME– time of observation or eventDV– dependent variable (measurement)DVID/YTYPE– type of measurement (Simurg accepts either)MDV– missing dependent variable flag (1 = missing, 0 = present)EVID– event identifier (0 = observation, >0 = event such as dosing)
If any of these columns are missing, the checks relying on them will be skipped, and the message “The column required for this check is missing” will appear in place of the corresponding results.
-
Presence of required columns
Confirms that all six time series columns are in the dataset.
- If any are missing: "The following required columns for time series checks are missing in the dataset:" followed by the list.
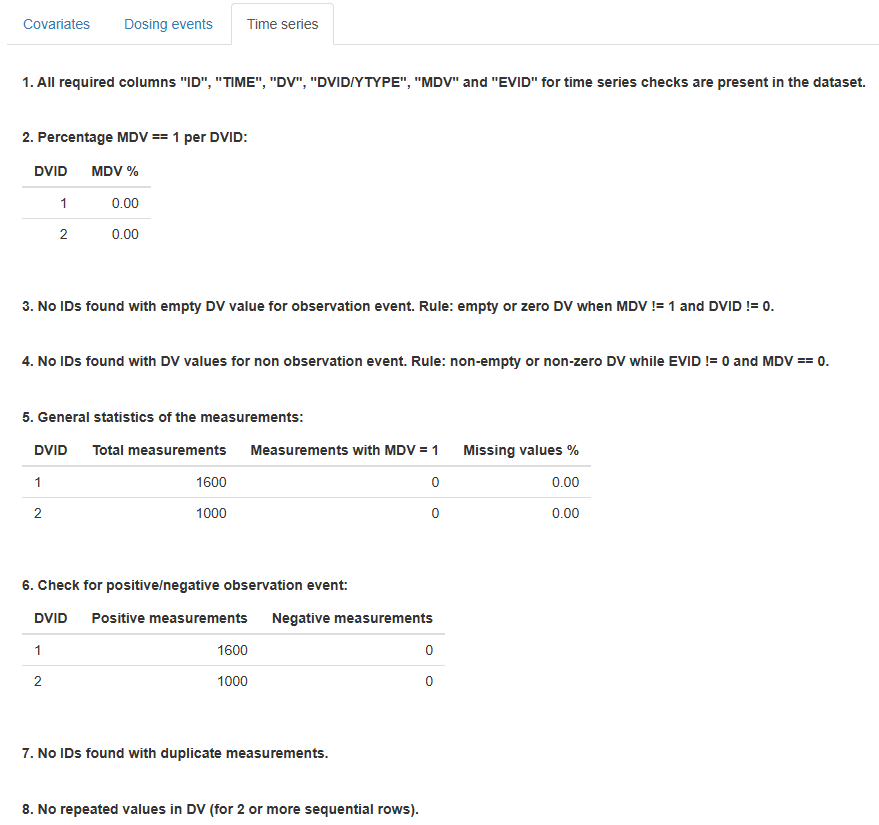
- If all are present: "All required columns "ID", "TIME", "DV", "DVID/YTYPE", "MDV", and "EVID" for time series checks are present in the dataset."
-
Missing data percentage (MDV == 1) per DVID
This check calculates the proportion of measurements marked as missing (
MDV = 1) for eachDVIDlevel.- Output: Table with columns
DVIDandMDV %
- Output: Table with columns
-
Empty or zero DV when MDV ≠ 1 and DVID ≠ 0 This flags rows where the dependent variable is missing or zero despite being marked as valid observations. Rule:
DVis empty or zero whileMDV ≠ 1andDVID ≠ 0.- If found: "IDs with empty or zero DV when MDV ≠ 1 and DVID ≠ 0:" plus table of
ID - Otherwise: "No IDs found with empty DV value for observation event."
- If found: "IDs with empty or zero DV when MDV ≠ 1 and DVID ≠ 0:" plus table of
-
Non-empty DV with EVID ≠ 0
This check detects non-observation events that improperly contain DV values. Rule:
EVID ≠ 0 & MDV = 0with a non-empty or non-zeroDV.- If found: "IDs with non-empty and non-zero DV while EVID ≠ 0 and MDV = 0:" plus
IDlist - Otherwise: "No IDs found with DV values for non observation event."
- If found: "IDs with non-empty and non-zero DV while EVID ≠ 0 and MDV = 0:" plus
-
General measurement statistics
Presents summary statistics for each
DVID, showing the number of measurements and percentage of missing values.- Output: "General statistics of the measurements:" plus table with columns
DVID,Total measurements,Measurements with MDV = 1,Missing values %
- Output: "General statistics of the measurements:" plus table with columns
-
Check for positive/negative DV values
Ensures that all measurement values make sense and are consistent in sign (e.g., no negative concentrations if not expected). Exclude rows with
MDV = 1.- Output: "Check for positive/negative observation event:" plus table with columns
DVID,Positive measurements,Negative measurements
- Output: "Check for positive/negative observation event:" plus table with columns
-
Duplicate observations
Identifies duplicated time points per ID for the same
DVID(excluding rows withMDV = 1). Rule: Duplicate (ID,TIME,DVID) combinations withAMT = 0.- If found: "IDs with duplicate measurements:" and table with
ID,TIME,DVID,total measurements - Otherwise: "No IDs found with duplicate measurements."
- If found: "IDs with duplicate measurements:" and table with
-
Repeated DV values across consecutive time points
Flags sequences where the same
DVvalue is repeated in 2 or more consecutive rows, which may suggest imputation or logging errors. ExcludeMDV = 1; check is done perDVID.- If found: "Same value repeated in DV (for 2 or more sequential rows):" plus affected IDs
- If none: "No repeated values in DV (for 2 or more sequential rows)"
These checks serve as a vital step in confirming the consistency and integrity of observational data before modeling, simulation, or visual exploration.
Q1 = first quartile, Q3 = third quartile, IQR = inter-quartile range (Q3 – Q1).