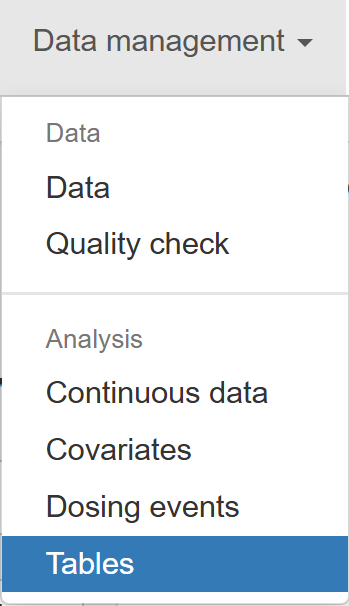
Tables
The Tables section is designed to facilitate the structured and semi-automated creation of statistical summary tables. It enables users to generate both Descriptive and Inferential statistical outputs using a highly configurable interface, tailored to the user’s specific dataset and analytical goals. Whether summarizing continuous variables, exploring distributions of categorical data, or comparing groups through hypothesis testing, this module provides a comprehensive yet flexible solution for table generation.
The section is divided into two main components, based on the type of statistics to be generated:
1. Descriptive Statistics
Work in this tab begins by specifying the type of data from which statistics will be extracted. This is done through the "Select data type:" window, where the user must choose between Continuous and Categorical. Once the data type is selected, the next window, "Select columns with continuous/categorical data:", allows the user to specify the variables of interest. Clicking the  button will then display the configuration panel relevant to the chosen data type.
1.1 Continuous
When Continuous is selected, the configuration panel displays a set of statistical options grouped by type. Users may select one or multiple measures to include in the output table:
-
Measures of central tendency:
MeanMedian
-
Measures of variability around the mean:
Standard Error (SE)Standard Deviation (SD)95% Confidence Interval (95% CI)
-
Measures of variability around the median:
RangeMedian Absolute Deviation (MAD)Interquartile Range (IQR)5th–95th Percentile2.5th–97.5th Percentile
Once the desired configuration is set, click  to generate the summary. The resulting table is displayed in the main panel and reflects the selected covariates and statistics.
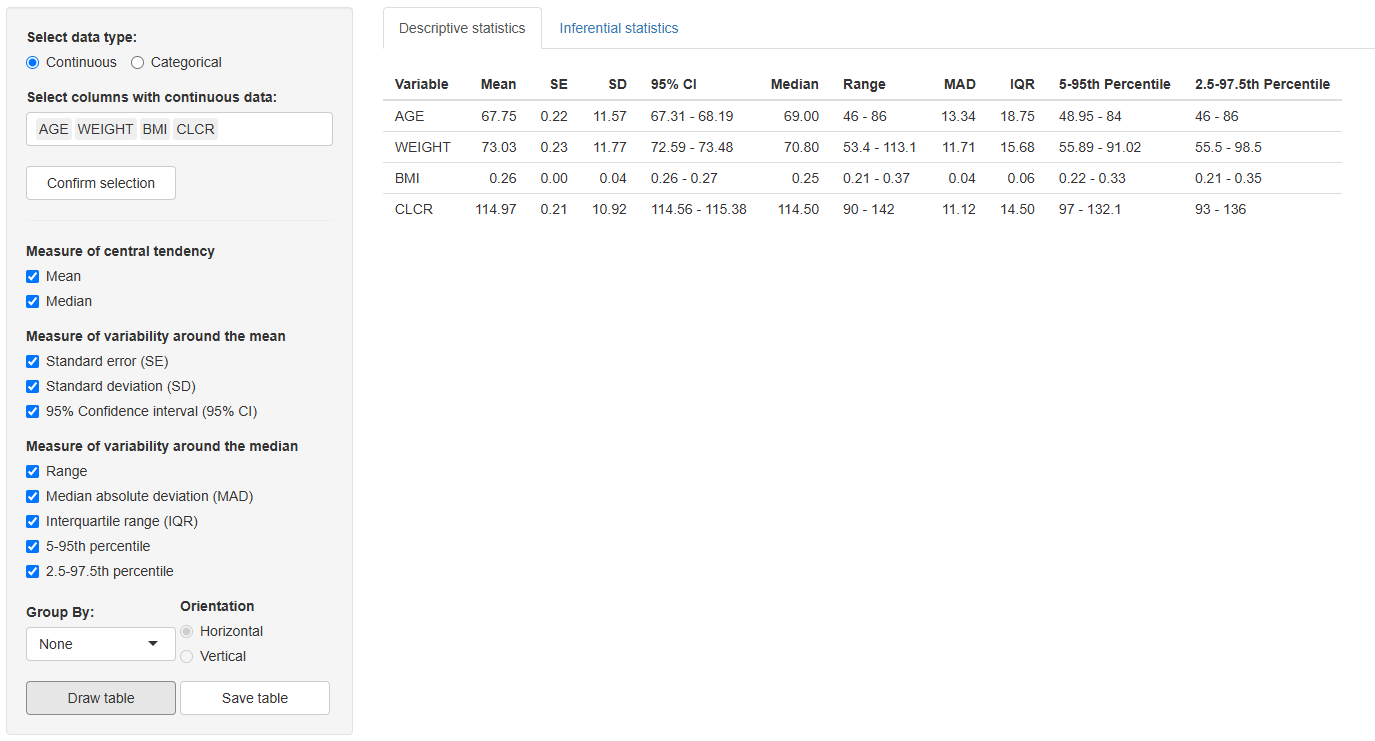
An additional option in this tab is "Group By:" (default is none). If a grouping variable is selected from the dataset, two Orientation styles become available:
-
Horizontalorientation: Adds the grouping column as a new row-level variable. Each group appears as a separate row, alongside an additional "Overall" row summarizing the full dataset.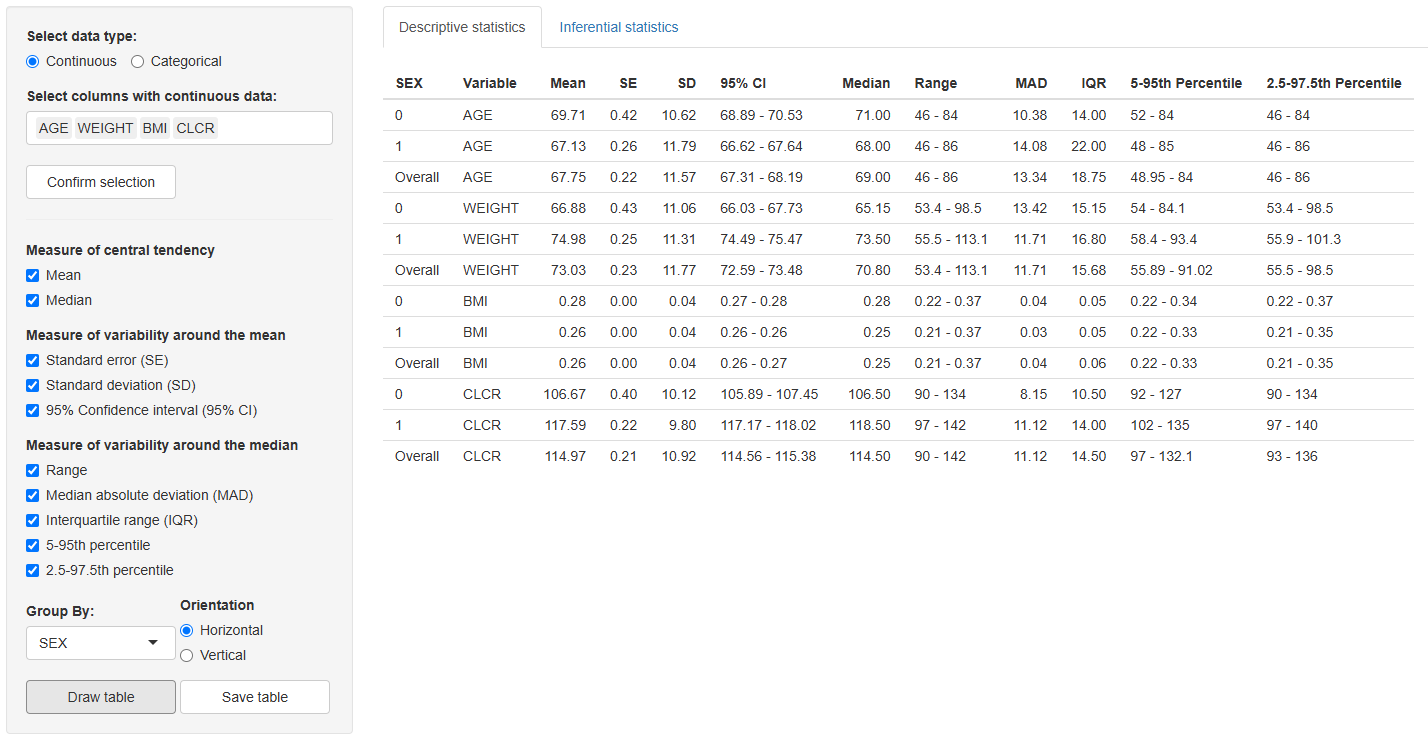
Figure 3. Descriptive statistics tab displaying the table configuration panel and the resulting table with continuous covariates AGE, WEIGHT, BMI, CLCR grouped by SEX using horizontal orientation.
-
Verticalorientation: Restructures the table with the following columns:Variable(selected covariates)Statistic(selected measures)One column per levelin the group-by variable, with an additionalOverallcolumn
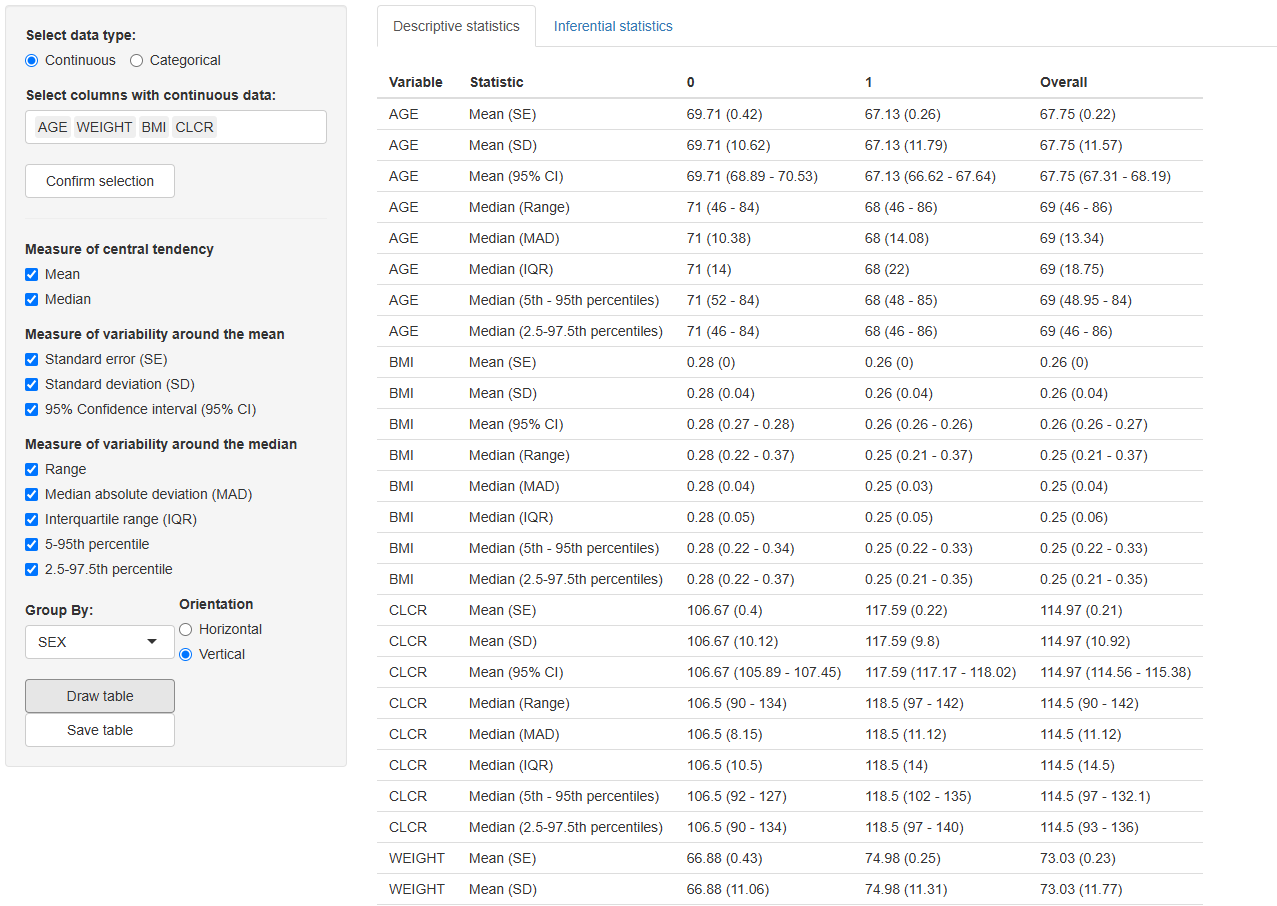
Figure 4. Descriptive statistics tab displaying the table configuration panel and the resulting table with continuous covariates AGE, WEIGHT, BMI, CLCR grouped by SEX using vertical orientation.
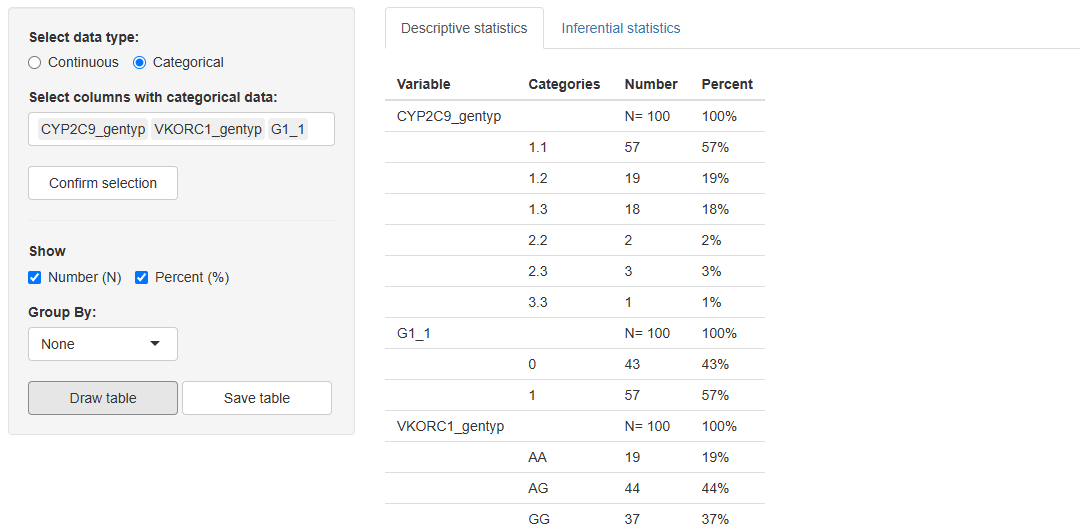
1.2 Categorical
If Categorical is selected as the data type, the configuration menu will offer the following options for descriptive summary, which can be selected simultaneously:
-
Number (N)– the absolute count of observations in each category -
Percent (%)– the proportion of observations in each category
Once the desired statistics are selected, click to generate the output. The resulting table will be displayed in the main panel and will include the following columns:
-
Variable– the name of the selected covariate -
Categories– the levels within each covariate -
Number– if selected -
Percent– if selected
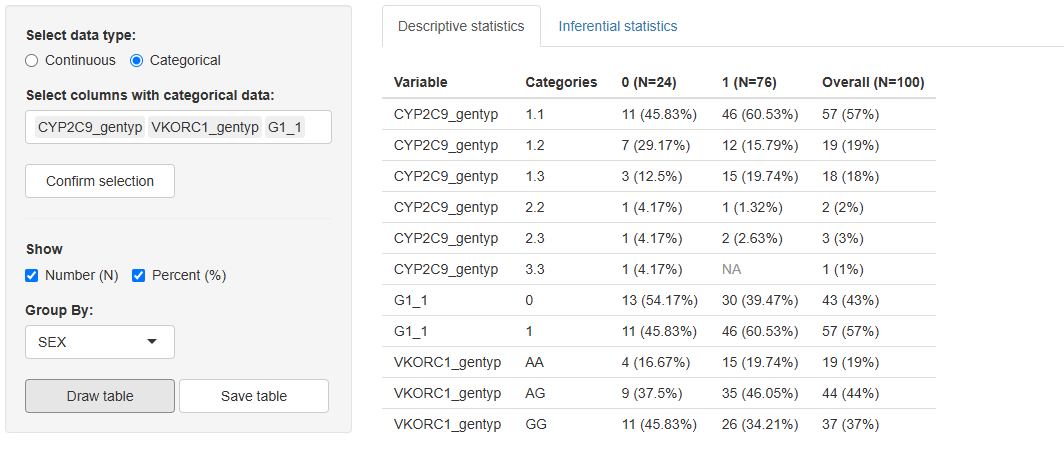
An additional feature in this tab is the "Group By:" option (none by default). If a grouping column is selected, the output table will expand to compare the distribution of each categorical variable across the levels of the grouping factor.
In this grouped output, the table retains the Variable and Categories columns. Each additional column corresponds to one of the levels in the selected grouping variable, annotated with the number of subjects in that group. A final column, Overall, provides a summary across all groups.
Use  to export the figure to the working directory set in Data section.
2. Inferential statistics
This tab provides the tools to perform correlation analyses between selected variables, offering a straightforward setup for generating inferential statistical tables.
Work in this tab begins by selecting the variables of interest from the available dataset columns. Two separate windows are provided:
- Select Y variable(s):
- Select X variable(s):
Once the variables have been chosen, click the button to display the configuration panel.
The configuration panel offers the following options for setting up the correlation analysis:
-
Correlation type:
PearsonSpearmanKendall
-
Additional outputs:
p-valueConfidence Interval
You may select one or more correlation types and include any combination of the additional outputs. Once the desired configuration is complete, click to generate the results.
If a correlation type other than Pearson is selected along with Confidence Interval, the following informational note will appear in the interface:
Note: Confidence intervals are only available for Pearson correlation.

Use to export the figure to the working directory set in Data section.
The Tables section provides a convenient and flexible way to generate descriptive and inferential statistical summaries. With customizable options and grouping features, it supports quick exploration and clear presentation of both continuous and categorical data—ideal for analysis, reporting, or quality control.