Covariates
The Covariates section of this module provides a comprehensive and flexible interface for exploring the general characteristics of covariates present in the dataset. Designed with ease of use in mind, this section enables automated visualization and statistical summary generation for both continuous and categorical variables, as well as covariate correlations. Through intuitive configuration tools, users can tailor plots and summaries to suit specific analytical needs and preferences.
The interface is divided into three main tabs based on the type of covariate visualization:
1. Continuous
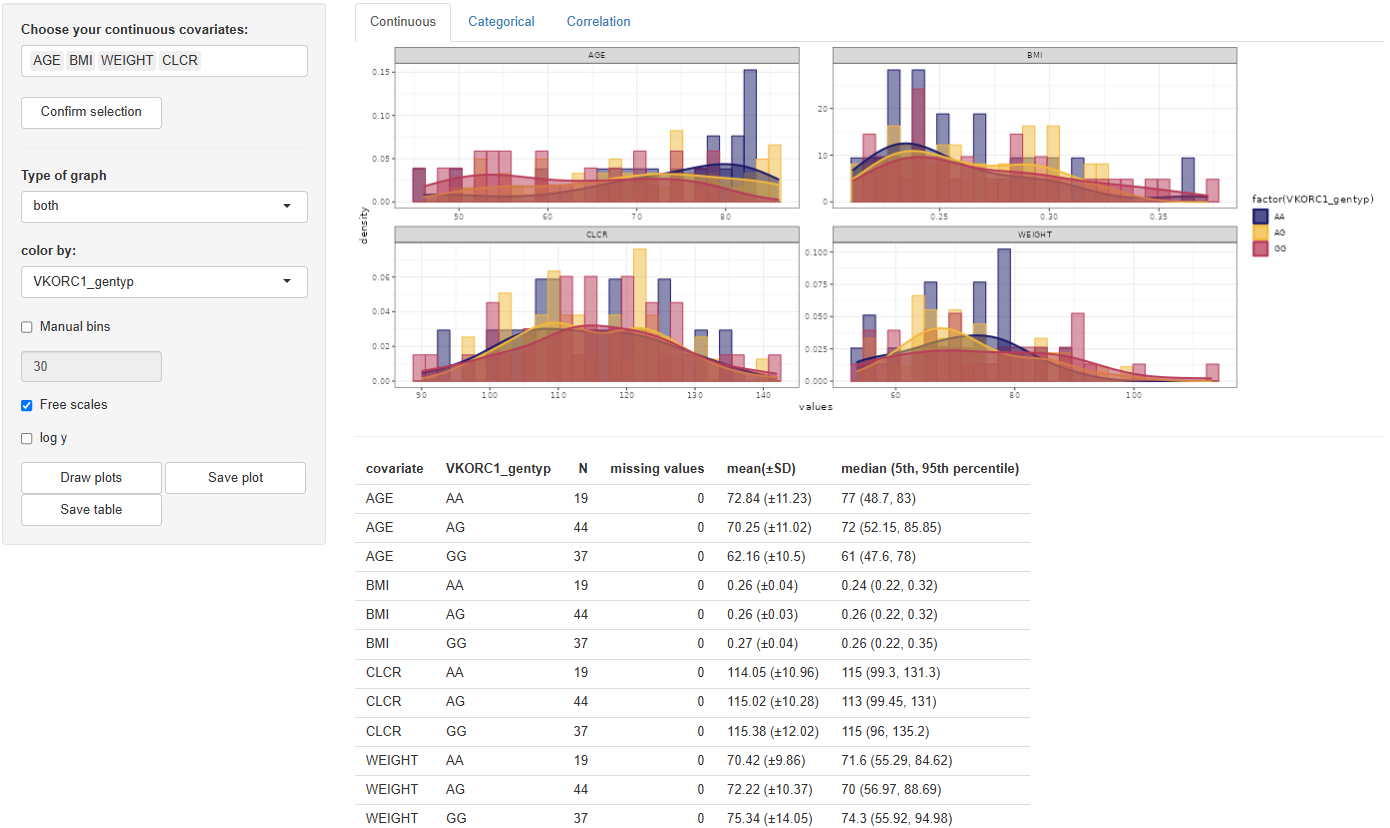
The Continuous tab enables visualization of the distribution and summary statistics of continuous covariates. Users begin by selecting the desired covariates in the "Choose your continuous covariates:" selection window. After making a selection, clicking  activates the configuration panel.
The available plot configuration tools include:
Type of graph:Options are histogram, density, or both (default).Color by:Any column from the dataset or none (“-” by default).Manual bins:Specify the number of histogram bins (default is 30).Free scales:Allows individual scaling per facet.Log y:Enables logarithmic scaling of the y-axis.
Once the configuration is finalized, clicking  will generate the corresponding visualization in the main panel.
Accompanying the plot, a table of descriptive statistics is automatically generated. This includes: N, Missing values, Mean (± SD), Median (5th, 95th percentile). If a "color by" variable is selected, these statistics will be grouped accordingly by its levels.
To export the results, use:
 to save the graph in the directory defined in the Data section.
 to export the statistics table to the same directory.
2. Categorical
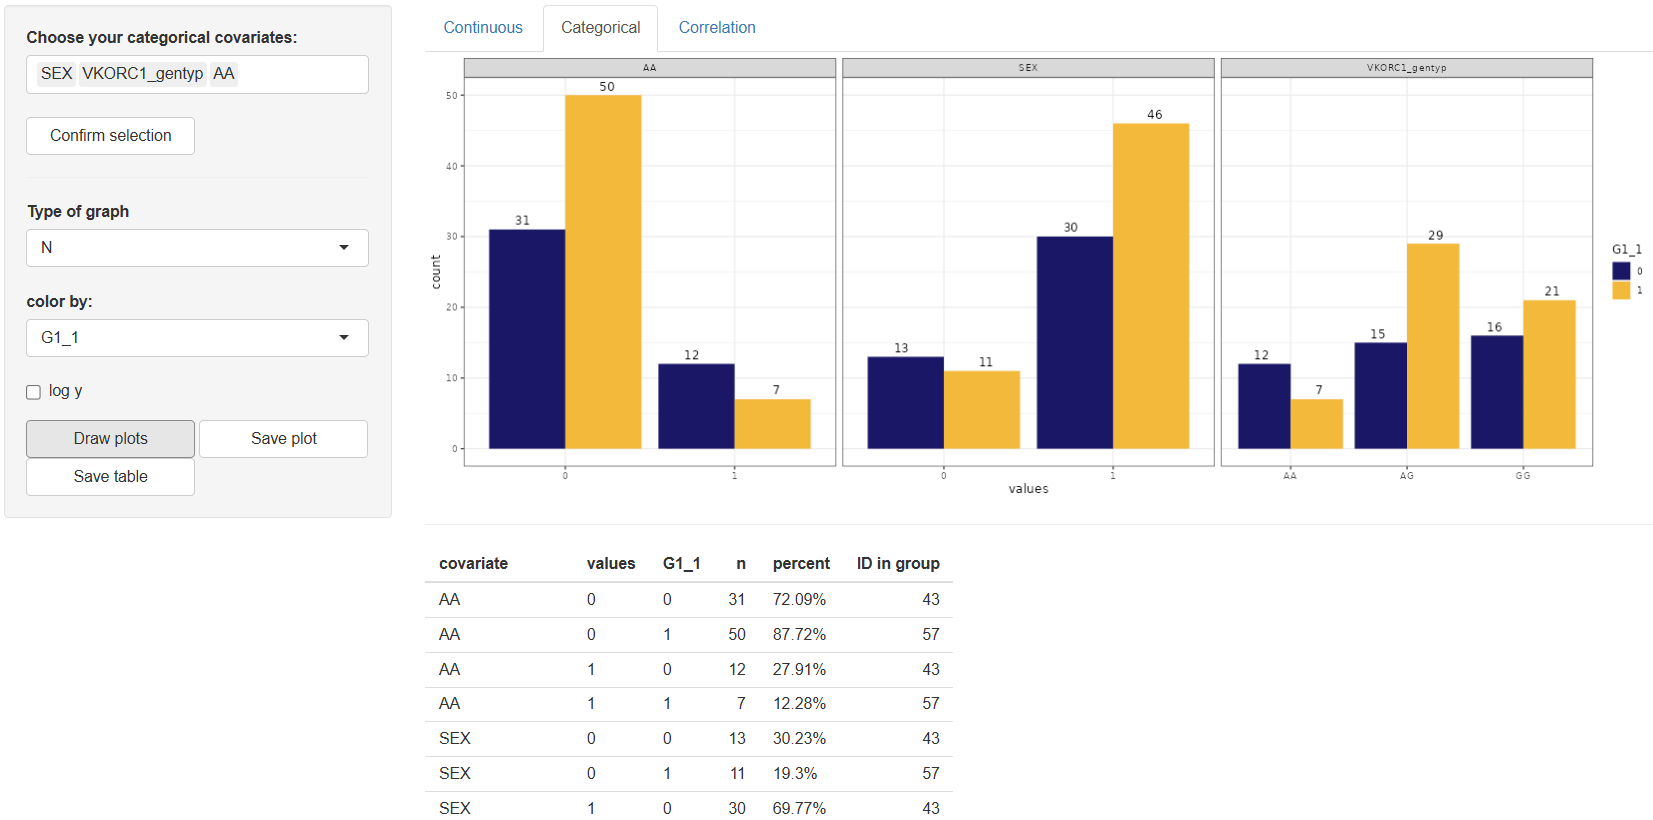
The Categorical tab is dedicated to the visualization of categorical covariates and offers a user-friendly interface for generating summary plots and descriptive statistics. Work in this tab begins with selecting the desired categorical covariates from the “Choose your categorical covariates:” window. Once the variables are selected, click to proceed.
Upon confirmation, the configuration panel becomes available with the following customizable options:
Type of graph:Options include "N" (count) or "%" (percentage). The default setting is "N".Color by:Allows grouping by any column in the dataset. The default value is "–" (no grouping).Log y:Enables a logarithmic scale on the y-axis for better visualization of skewed distributions.
After adjusting the configuration to your needs, click the button. The resulting plot will be displayed in the main panel, accompanied by a descriptive table. The table includes the following columns for each category:
n– Number of observationspercent– Percentage of observationsID in group– Identifiers belonging to each category (if applicable)
If the color by option is used, statistics will be grouped accordingly.
To save your results, use the button to export the graph and the button to export the statistics table. Both files will be saved to the working directory specified in the Data section.
3. Correlation
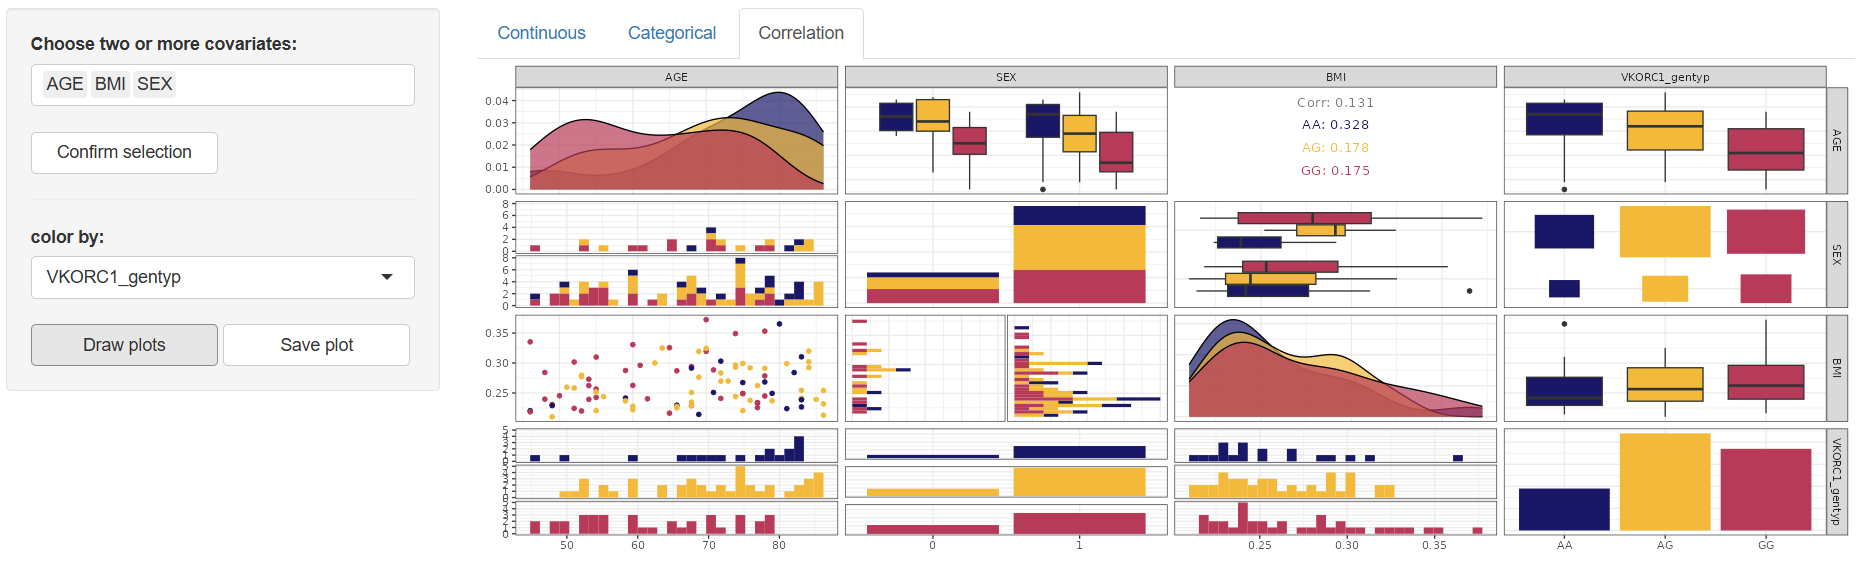
The Correlation tab is designed to explore the relationships between continuous or categorical covariates. Work in this tab begins by selecting two or more covariates in the “Choose two or more covariates:” window. Once your selection is made, click to activate the configuration panel.
The available configuration tool is:
Color by:Enables grouping the correlation plot by any column in the dataset. The default value is “–” (no grouping applied).
Once the configuration is defined, click to generate the correlation matrix plot in the main panel. This plot visually presents the pairwise correlations between the selected covariates.
To save the output, use the button. The figure will be stored in the working directory defined in the Data section.
The Covariates section offers an intuitive and flexible environment for the graphical exploration and summary of both continuous and categorical variables in the dataset. Complemented by accompanying summary tables and export functions, this section ensures a comprehensive understanding of covariate behavior and structure—an essential step in data preparation and exploration.