Initial estimates
The Initial estimates tab enables users to define and visually evaluate the starting values of fixed-effect model parameters. Providing well-informed initial estimates can significantly improve the speed and stability of the model fitting process.
📌 Note: Before using this tab, make sure both the Data and Model sections have been properly initialized.
Getting Started
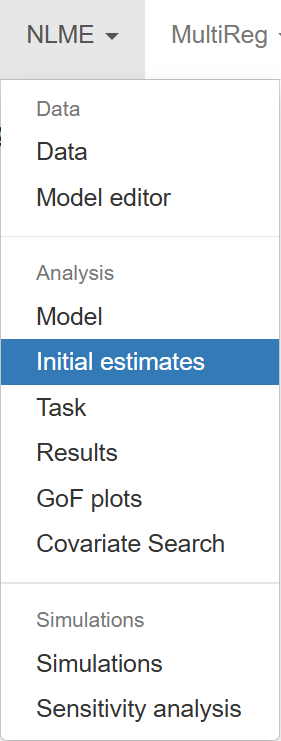
To begin, navigate to the Initial estimates tab:
Click the  button to import the initial parameter estimates directly from the model file. The values retrieved depend on the modeling syntax used:
-
For models written in Simurg syntax, parameter values explicitly set in the model definition will be retrieved.
-
RxODE syntax, which shares structural similarities with Simurg's syntax, is also supported. If RxODE-style models are used, initial values are read in the same way.
-
For mlxtran syntax, initial values default to 1 unless manually modified.
💡 Simurg is compatible with multiple modeling languages and can interpret both RxODE and mlxtran syntaxes in addition to its own native syntax.
Adjusting and Evaluating Initial Values
Parameter values for fixed effects can be edited using the panel on the right side of the interface. This panel is divided into three functional sections:
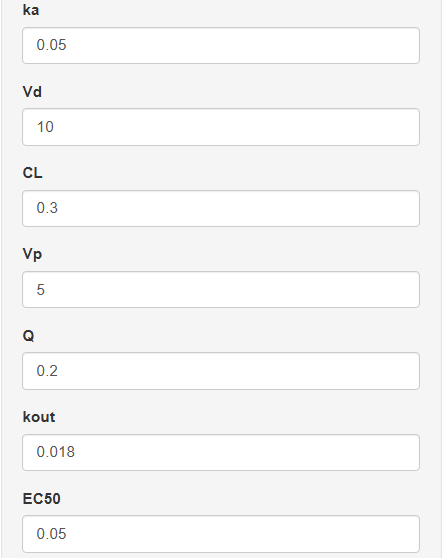
1. Parameter Input Panel
In the first section, you can edit the initial values of the fixed-effect parameters as specified in the model. These editable fields allow you to fine-tune the starting estimates before fitting begins.
2. Output Selection Panel
If your model includes multiple outputs (DVIDs), the second section of the panel enables you to choose which output to visualize. This is particularly helpful for models that simulate multiple endpoints or compartments.

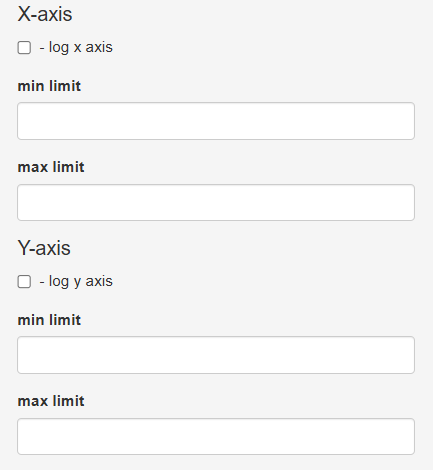
3. Plot Configuration Panel
In the third section, you can customize the plot appearance. Options include:
-
Enabling or disabling log scale for the x-axis (time) and y-axis (output)
-
Adjusting the minimum and maximum limits for both axes manually
These controls help ensure the resulting plot is tailored to your data's scale and characteristics.
After adjusting the configuration in these sections, click the  Show plots button. This will display a set of time-profile plots comparing model predictions (based on your current initial estimates) against observed data for each individual in the dataset.
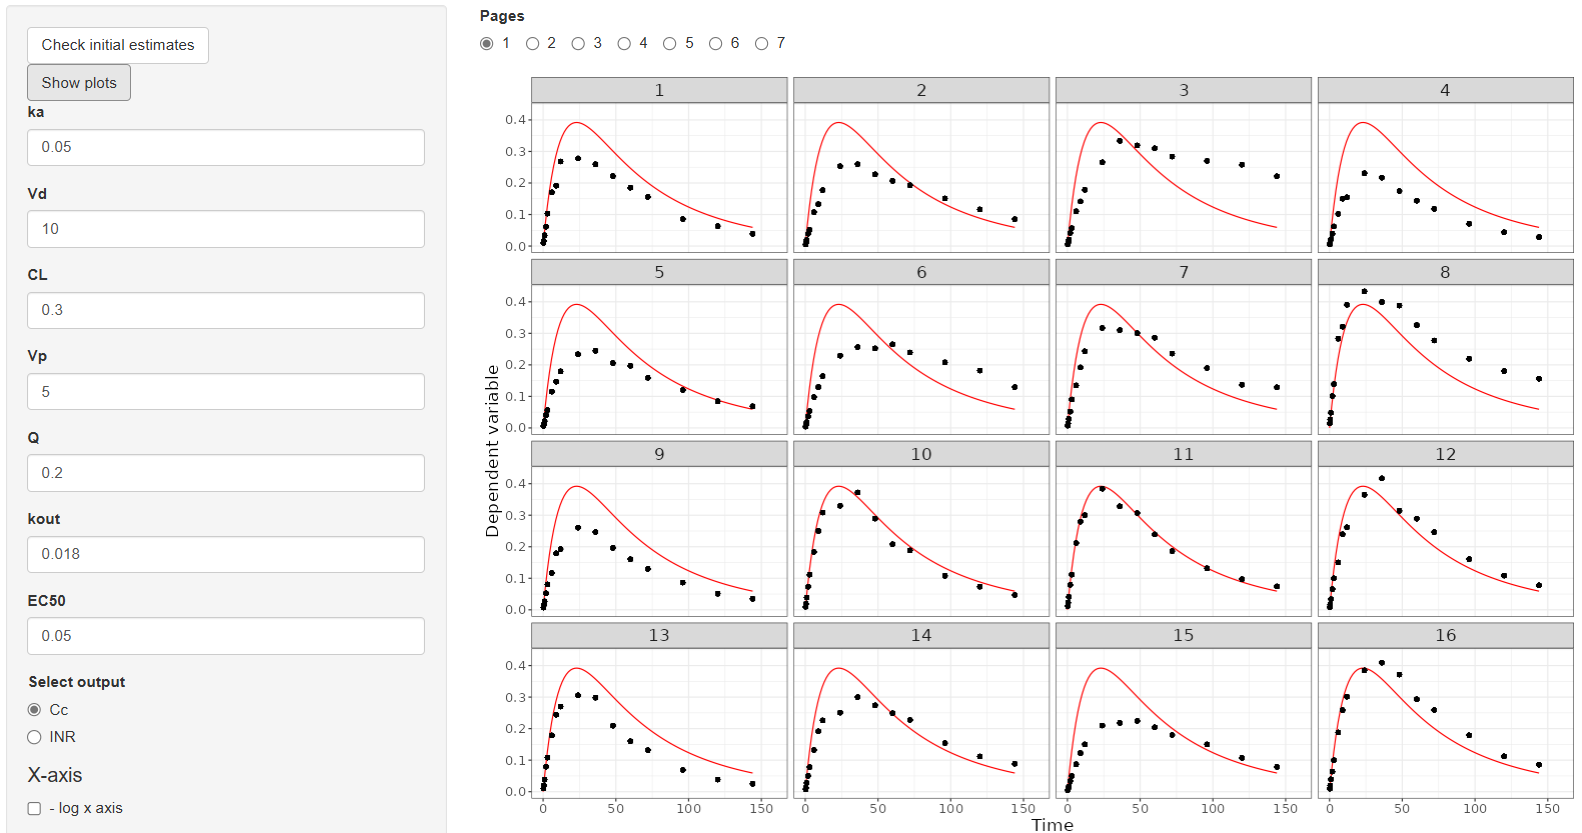
This interactive evaluation step helps you visually assess whether your initial estimates are plausible before proceeding with model calibration.
Resetting and Proceeding
To revert changes and restore the original parameter values from the model file, simply click the button again.
Once you're satisfied with the initial estimates, proceed to the Task tab to configure statistical components. These initial values will be used as starting points for model fitting.